top of page

20 Most Populated Counties by Race/Ethnicity

Population
white_top20.jpg
black_top20.jpg
latine_top20.jpg

20 Least Populated Counties by Race/Ethnicity

white_bottom20.jpg
black_bottom20.jpg
latine_bottom20.jpg

Number of White Persons for every Black Person

no_white_per_black_top20.jpg
no_white_per_black_bottom20.jpg
Fund Allocation

Fund Allocation for the 20 Most and Least Populated Counties by Race/Ethnicity

allocation_latine_top20.jpg
allocation_latine_bottom20.jpg

Fund Allocation x White:Black Ratio

allocation_white-black_top20.jpg
allocation_white-black_bottom20.jpg

Funds Paid per Child for the 20 Most and Least Populated Counties by Race/Ethnicity

Fund Payment
payment_white_top20.jpg
payment_white_bottom20.jpg
payment_black_top20.jpg
payment_black_bottom20.jpg
payment_latine_top20.jpg
payment_latine_bottom20.jpg

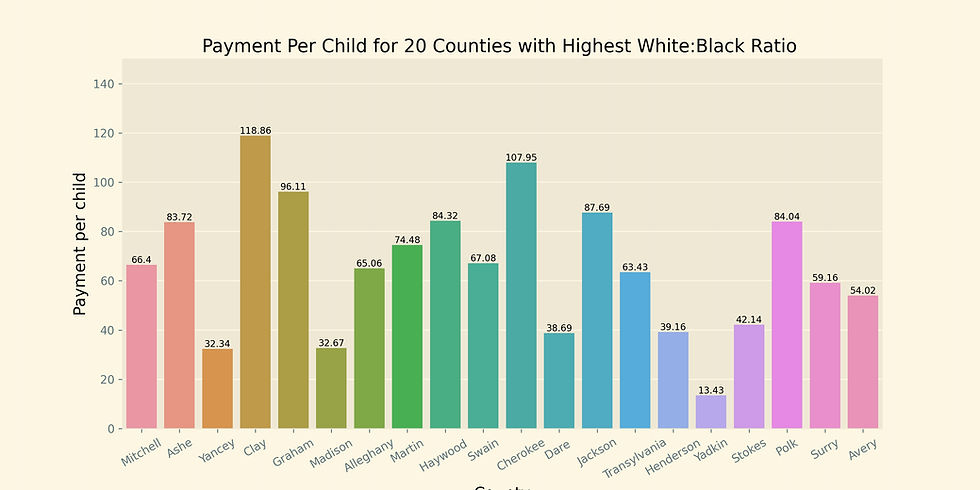
Fund Payment x White:Black Ratio

payment_white-black_top20.jpg
payment_white-black_bottom20.jpg

Percent of Children Paid for 20 Highest & Lowest Populated Counties by Race/Ethnicity

Percent of Children Paid
percentpaid_white_top20.jpg
percentpaid_white_bottom20.jpg
percentpaid_black_top20.jpg
percentpaid_black_bottom20.jpg
percentpaid_latine_top20.jpg
percentpaid_latine_bottom20.jpg

Percent of Children Paid x White:Black Ratio

percentpaid_white-black_top20.jpg
percentpaid_white-black_bottom20.jpg

Percent of Children Served for 20 Highest & Lowest Populated Counties by Race/Ethnicity

Percent of Children Served
childrenserved_white_top20.jpg
childrenserved_white_bottom20.jpg
childrenserved_black_top20.jpg
childrenserved_black_bottom20.jpg
childrenserved_latine_top20.jpg
childrenserved_latine_bottom20.jpg

Percent of Children Served x White:Black Ratio

childrenserved_white-black_top20.jpg
childrenserved_white-black_bottom20.jpg
Percent of Children Waiting

Percent of Children Waiting for 20 Highest & Lowest Populated Counties by Race/Ethnicity

childrenwaiting_white_top20.jpg
childrenwaiting_white_bottom20.jpg
childrenwaiting_black_top20.jpg
childrenwaiting_black_bottom20.jpg
childrenwaiting_latine_top20.jpg
childrenwaiting_latine_bottom20.jpg

Percent of Children Served x White:Black Ratio

childrenwaiting_white-black_top20.jpg
childrenwaiting_white-black_bottom20.jpg

Ratio of Children: 3-5 Star Facilities for 20 Most and Least Populated Counties by Race/Ethnicity

Ratio of Children : 3-5 Star Facilities
facilities_white_top20.jpg
facilities_white_bottom20.jpg
facilities_black_top20.jpg
facilities_black_bottom20.jpg
facilities_latine_top20.jpg
facilities_latine_bottom20.jpg

Ratio of Children:3-5 Star Facility x White:Black Ratio

facilities3-5_white-black_top20.jpg
facilities3-5_white-black_bottom20.jpg
bottom of page